Open Tracing
Introduction
What is Distributed Tracing?
Distributed tracing is a method used to profile and monitor applications,
especially those built using Micro Service architecture. Distributed tracing helps pinpoint where failures occur and what causes poor performance.
How OpenTracing fits into this?
The OpenTracing API provides a standard, vendor-neutral framework for instrumentation. This means that if a developer wants to try out a different distributed tracing system, then instead of repeating the whole instrumentation process for the new distributed tracing system, the developer can simply change the configuration of the Tracer.
Here are some basic terminologies of Open Tracing:
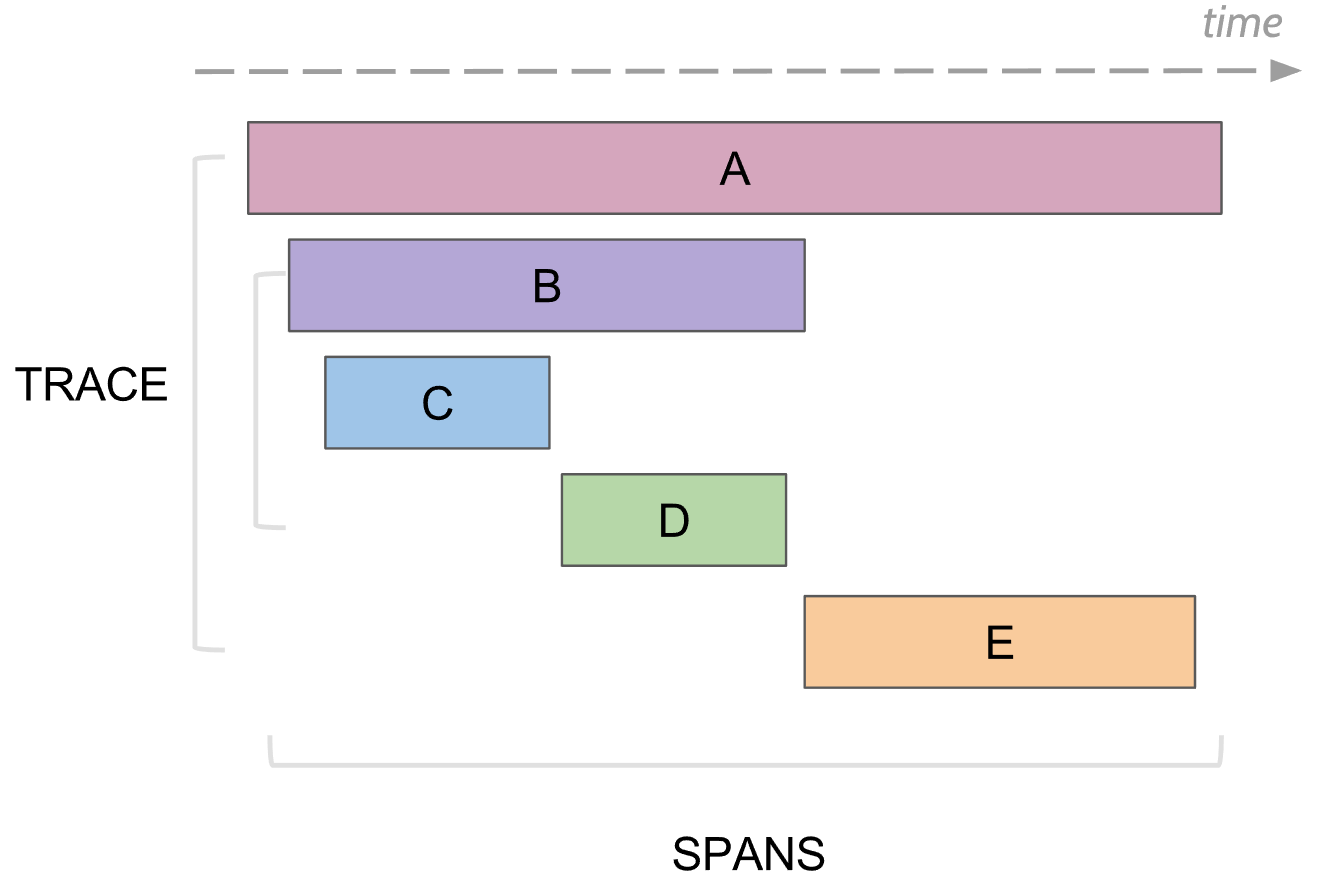
- Span - It represents a logical unit of work that has an operation name, the start time of the operation, and the duration
- Trace - A trace tells the story of a transaction or workflow as it propagates through a distributed system. It is simply a set of spans sharing a TraceId. Each component in a distributed system contributes its own span.
Open Tracing is a way for services to “describe and propagate distributed traces without knowledge of the underlying OpenTracing implementation”.
In real life, applications are even more complex and with the increasing complexity of applications, monitoring the applications has been a tedious task. OpenTracing helps us to easily monitor:
- Spans of services
- Time taken by each service
- Latency between the services
- Hierarchy of services
- Errors or exceptions during execution of each service
Jaeger: A distributed Tracing System by Uber
Jaeger, inspired by Dapper and OpenZipKin, is a distributed tracing system released as open source by Uber Technologies. It is used for monitoring and troubleshooting microservices-based distributed system, including:
- Distributed transaction monitoring
- Performance and latency optimization
- Root cause analysis
- Service dependency analysis
- Distributed context propagation
Major Components of Jaeger
Jaeger Client Libraries - Jaeger clients are language-specific implementations of the OpenTracing API
Agent - The Jaeger agent is a network daemon that listens for spans sent over UDP, which it batches and sends to the collector. It is designed to be deployed to all hosts as an infrastructure component. The agent abstracts the routing and discovery of the collectors away from the client.
Collector - The Jaeger collector receives traces from Jaeger agents and runs them through a processing pipeline. Currently, the pipeline validates traces, indexes them, performs transformations, and finally, stores them. Jaeger’s storage is a pluggable component which currently supports Cassandar, Elasticsearch, and Kafka.
Query - Query is a service that retrieves traces from storage and hosts a UI to display them.
Ingester - Ingester is a service that reads from Kafka topic and writes to another storage backend (Cassandra, Elasticsearch).
Running Jaeger in Docker Container
- First, install Jaeger Client on your machine
pip3 install jaeger-client
- Now, let’s run Jaeger backend as an all-in one Docker image. The image launches the JaeUI, collector, query and agent:
docker run -d -p6831:6831/udp -p16686:16686 jaegertracing/all-in-one:latest
Once the container starts, open http://localhost:16686/ to access the jaeger UI. The container runs the Jaeger backend with an in-memory store, which is initially empty, so there is not much we can do with the UI right now since the store has no traces.
Creating Traces on Jaeger UI
- Create a Python program to create Traces
Let’s generate some traces using a simple python program. You can clone the Jaeger-Opentracing repository given below for a sample program that is used in this blog.
import sys
import time
import logging
import random
from jaeger_client import Config
from opentracing_instrumentation.request_context import get_current_span, span_in_context

def init_tracer(service):
    logging.getLogger('').handlers = []
    logging.basicConfig(format='%(message)s', level=logging.DEBUG)
    config = Config(
        config={
            'sampler': {
                'type': 'const',
                'param': 1,
            },
            'logging': True,
        },
        service_name=service,
    )
    return config.initialize_tracer()

def booking_mgr(movie):
    with tracer.start_span('booking') as span:
        span.set_tag('Movie', movie)
        with span_in_context(span):
            cinema_details = check_cinema(movie)
            showtime_details = check_showtime(cinema_details)
            book_show(showtime_details)

def check_cinema(movie):
    with tracer.start_span('CheckCinema', child_of=get_current_span()) as span:
        with span_in_context(span):
            num = random.randint(1,30)
            time.sleep(num)
            cinema_details = "Cinema Details"
            flags = ['false', 'true', 'false']
            random_flag = random.choice(flags)
            span.set_tag('error', random_flag)
            span.log_kv({'event': 'CheckCinema' , 'value': cinema_details })
            return cinema_details

def check_showtime( cinema_details ):
    with tracer.start_span('CheckShowtime', child_of=get_current_span()) as span:
        with span_in_context(span):
            num = random.randint(1,30)
            time.sleep(num)
            showtime_details = "Showtime Details"
            flags = ['false', 'true', 'false']
            random_flag = random.choice(flags)
            span.set_tag('error', random_flag)
            span.log_kv({'event': 'CheckCinema' , 'value': showtime_details })
            return showtime_details

def book_show(showtime_details):
    with tracer.start_span('BookShow',  child_of=get_current_span()) as span:
        with span_in_context(span):
            num = random.randint(1,30)
            time.sleep(num)
            Ticket_details = "Ticket Details"
            flags = ['false', 'true', 'false']
            random_flag = random.choice(flags)
            span.set_tag('error', random_flag)
            span.log_kv({'event': 'CheckCinema' , 'value': showtime_details })
            print(Ticket_details)

assert len(sys.argv) == 2
tracer = init_tracer('booking')
movie = sys.argv[1]
booking_mgr(movie)
# yield to IOLoop to flush the spans
time.sleep(2)
tracer.close()
The Python program takes a movie name as an argument and calls three functions that get the cinema details, movie showtime details, and finally book a movie ticket.
It creates some random delays in all the functions to make it more interesting, as, in reality, the functions would take a certain time to get the details. Also, the function throws random errors to give us a feel of how the traces of a real-life application may look like in case of failures.
Here is a brief description of how OpenTracing has been used in the program:
- Initializing a tracer:
def init_tracer(service):
   logging.getLogger('').handlers = []
   logging.basicConfig(format='%(message)s', level=logging.DEBUG)
   config = Config(
       config={
           'sampler': {
               'type': 'const',
               'param': 1,
           },
           'logging': True,
       },
       service_name=service,
   )
   return config.initialize_tracer()
- Using the tracer instance
with tracer.start_span('CheckCinema', child_of=get_current_span()) as span:
- Starting new child spans using start_span:
with tracer.start_span('CheckCinema', child_of=get_current_span()) as span:
- Using Tags:
span.set_tag('Movie', movie)
- Using Logs:
span.log_kv({'event': 'CheckCinema' , 'value': cinema_details })
- Run the python program
$ python booking-mgr.py <movie-name>

Initializing Jaeger Tracer with UDP reporter
Using sampler ConstSampler(True)
opentracing.tracer initialized to <jaeger_client.tracer.Tracer object at 0x7f72ffa25b50>[app_name=booking]
Reporting span cfe1cc4b355aacd9:8d6da6e9161f32ac:cfe1cc4b355aacd9:1 booking.CheckCinema
Reporting span cfe1cc4b355aacd9:88d294b85345ac7b:cfe1cc4b355aacd9:1 booking.CheckShowtime
Ticket Details
Reporting span cfe1cc4b355aacd9:98cbfafca3aa0fe2:cfe1cc4b355aacd9:1 booking.BookShow
Reporting span cfe1cc4b355aacd9:cfe1cc4b355aacd9:0:1 booking.booking
Now, check your jaeger UI, you can see a new service “booing” added. Select the service and click on “Find Traces” to see the traces of your service.
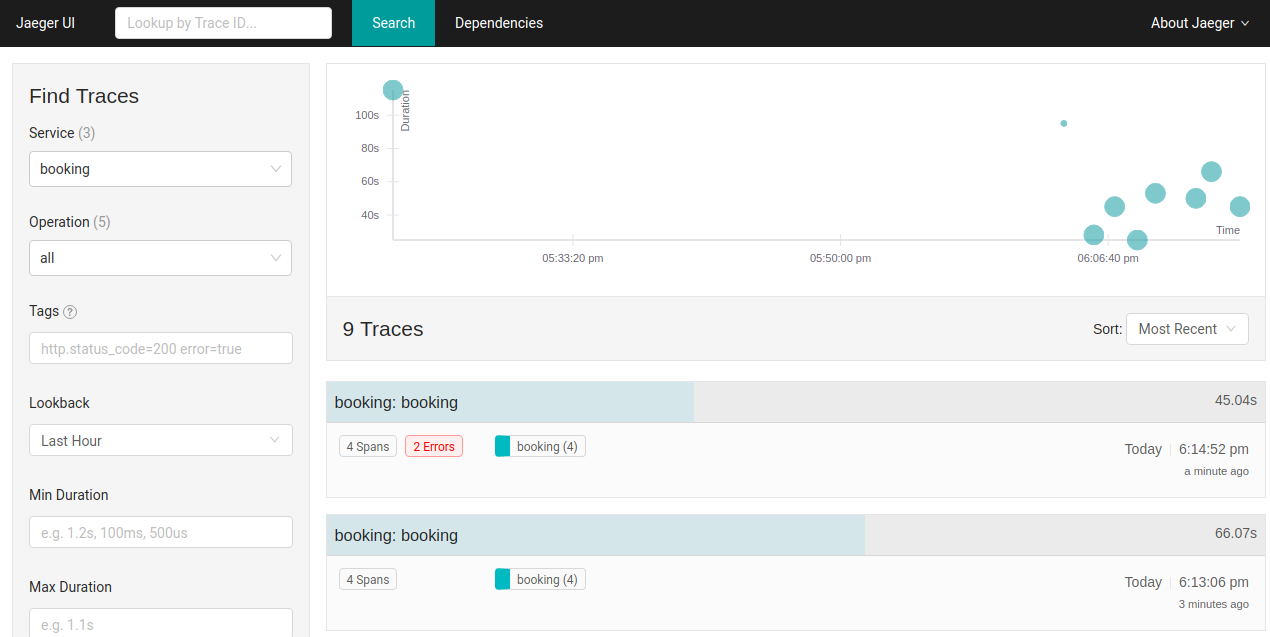
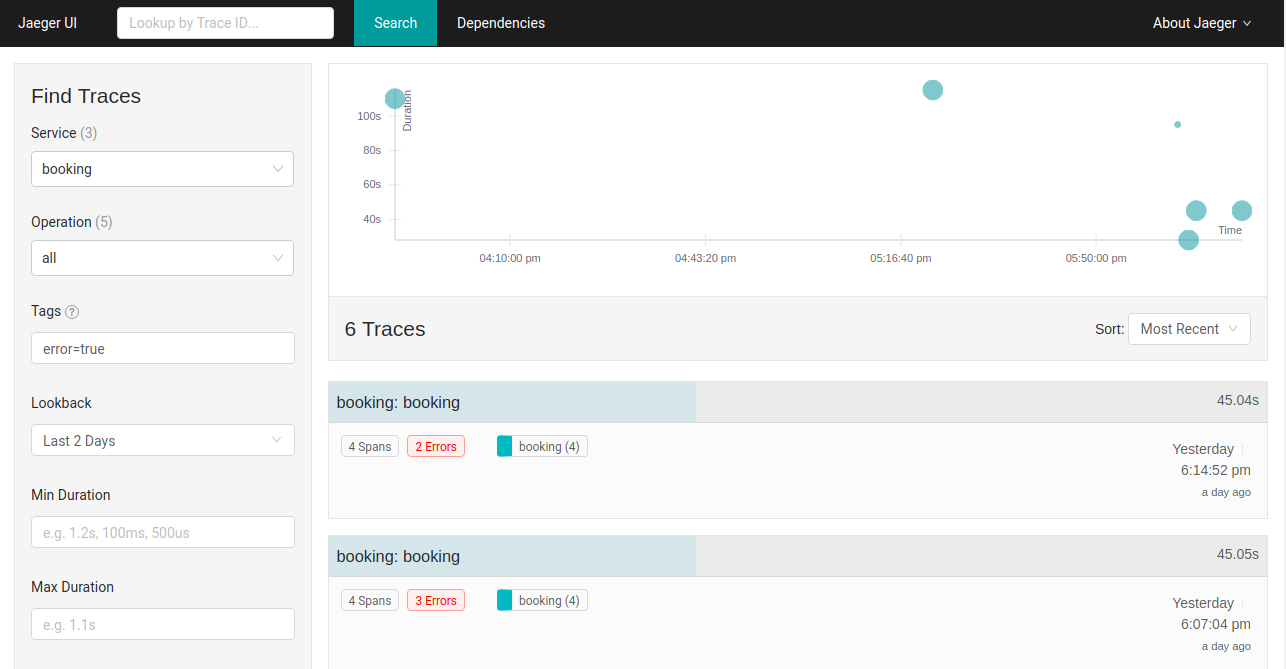
You can now compare the duration of traces through the graph shown above. You can also filter traces using “Tags” section under “Find Traces”. For example, Setting “error=true” tag will filter out all the jobs that have errors, as shown:
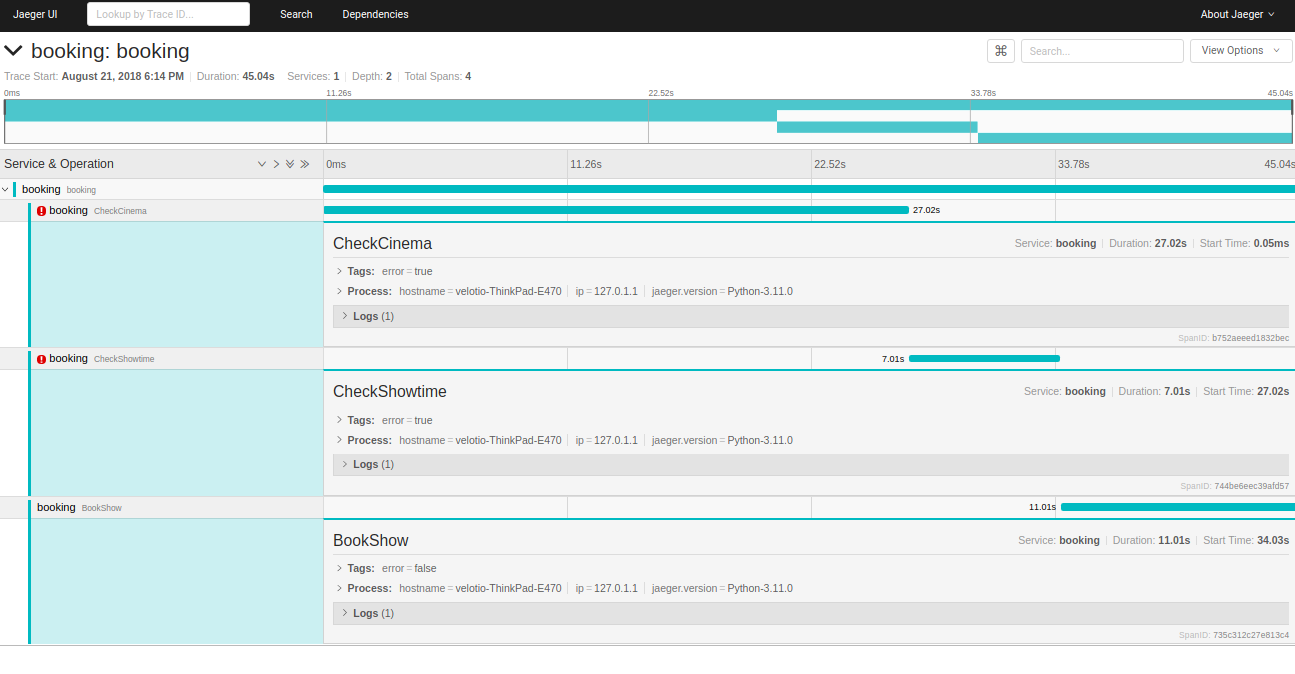
To view the detailed trace, you can select a specific trace instance and check details like the time taken by each service, errors during execution and logs
**Conclusion**
In this blog, we’ve described the importance and benefits of OpenTracing, one of the core pillars of modern applications. We also explored how distributed tracer Jaeger collect and store traces while revealing inefficient portions of our applications. It is fully compatible with OpenTracing API and has a number of clients for different programming languages including Java, Go, Node.js, Python, PHP, and more.